Problem 1
Nobody knows why a request is refused
A 403 or a 429 with no explanation.
Flexway's answer: Every refusal carries its reason in the trace and the log; the console opens the trace from the operation.
Operations
OpenTelemetry logs, metrics and traces propagated end to end; a rich, built-in console that reads traffic, health and usage, and turns every change into a pull request.
18 of the 19 shown delivered · since v0.1.0
What you expect from this domain
Problem 1
A 403 or a 429 with no explanation.
Flexway's answer: Every refusal carries its reason in the trace and the log; the console opens the trace from the operation.
Problem 2
Dashboards and alerts to build before seeing anything.
Flexway's answer: Dashboards, alerts and objectives built into the console, nothing to install.
Problem 3
A console that writes directly bypasses review.
Flexway's answer: Every change is a diff proposed as a pull request, never a write.
Every step is a decision readable in the trace and in the console.
Operations - Domain diagram: who calls, the decision steps, what is called, and where a request is refused.
personal data: never in clear
Every request that crosses Flexway: each leaves a log, metrics and a trace, with no personal data in clear.
Routes through here
Your operators: they follow traffic and health in the console and propose a change as a pull request.
Routes through here
One structured JSON log line per request, with no personal data in clear.
Routes through here
Metrics per operation, per upstream and per tenant, with bounded cardinality.
Routes through here
A W3C trace propagated end to end, from the caller to the upstream.
Routes through here
The console shows traffic, upstream health and consumption, with no external tool to install.
Routes through here
Alerts on thresholds (errors, latency, circuit breaker), tracked in the console and notified by webhook.
Routes through here
A change prepared in the console becomes a diff opened as a pull request, never a write to production.
Routes through here
Your observability: OpenTelemetry traces and metrics sent by Flexway, on your premises.
Routes through here
The dashboards built into the console: traffic, latencies and health, without an external stack.
Routes through here
The pull request in your Git: the only way to change the configuration, reviewed by a person.
Deploy Flexway: topologies and the GitOps configuration cycle
The essentials of each topic, with its status in the published release; unfold a card for the full text.
Logs are structured JSON, correlated by trace_id, with no personal data in clear: hashed identifiers, no prompt and no body.
Logs are structured JSON and contain no personal data in clear: identifiers are hashed, prompts and bodies are never logged, and a refused API key is named by its identifier, never by its value. Each line is correlated by trace_id, including a fatal error, which is structured as well.
The level is set in observability.log_level (debug, info, warn, error, fatal) and reloads hot. On the caller side, every error response carries a request_id and a trace_id: the details stay in the log, where operators find them from the identifier the client passes on.
Metrics are indexed by contract operation, upstream and tenant, with cardinality bounded by construction.
Metrics are indexed by contract operation, by upstream and by tenant: throughput, latency by quantile, response codes, in-flight requests, tokens. Dimensions come from the contract and the token, with nothing to configure, and a dashboard searches for POST /orders, not /orders/8f21c.
Cardinality is bounded by design: a thousand distinct paths and a thousand tenants produce a bounded number of series, which the tests check. Metrics are exposed on /metrics and exported over OTLP; dedicated families cover reloads, cache, delegation, inference and open streams.
The W3C traceparent is propagated from the edge to the upstream and the model, each executed policy adding an attribute to the trace.
The W3C traceparent is propagated, or created if missing, from the edge to the upstream and the model: a trace crosses the gateway without breaking context. Each executed policy adds an attribute, a degradation is marked, and external policy calls show up as child spans. On sampled requests, the routing, identity and policy stages have their own spans.
Export goes through observability.otlp_endpoint to your OTLP collector; an empty endpoint disables export, and that is a valid configuration. Sampling is adaptive: observability.sampling.max_per_second caps root traces per replica, and the parent's decision is honoured.
The API catalogue is built from the contracts the gateway loads, with owner and retirement date declared in the contract.
The API catalogue is built from the contracts loaded by the gateway, never from separate input: facets, a side panel per operation, a miniature policy chain, traffic per operation and export. An operation's owner is declared in the contract with x-flexway-owner - a team and a team channel, never a person - and a retirement date with x-flexway-sunset, which requires deprecated: true.
The Compliance tab computes rules over the catalogue, such as operations without an owner or deprecated without a date; a retirement date set on an operation that is not deprecated is refused at load. This information is never read on the request path.
A developer portal - catalogue, try-it and keys for the consumers of your APIs - is upcoming, as a surface separate from the console.
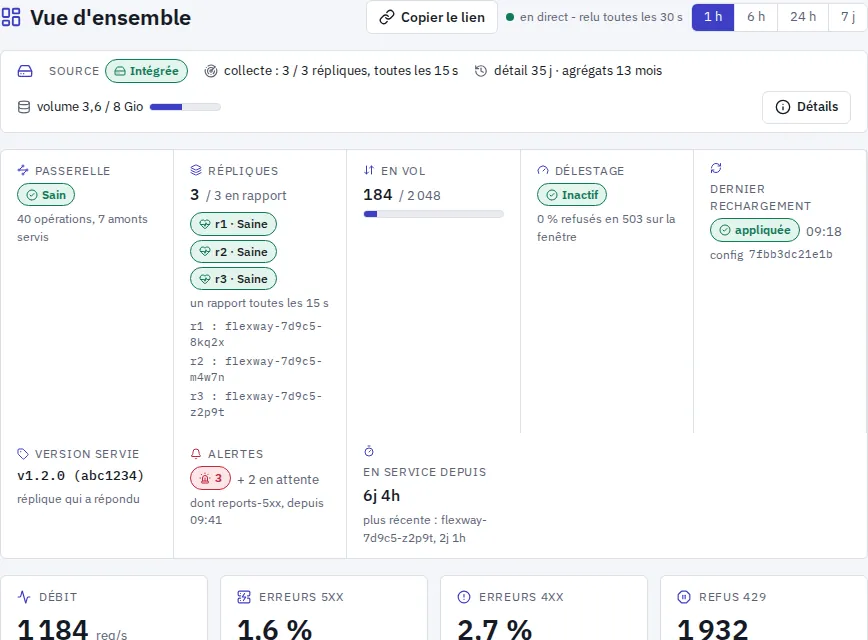
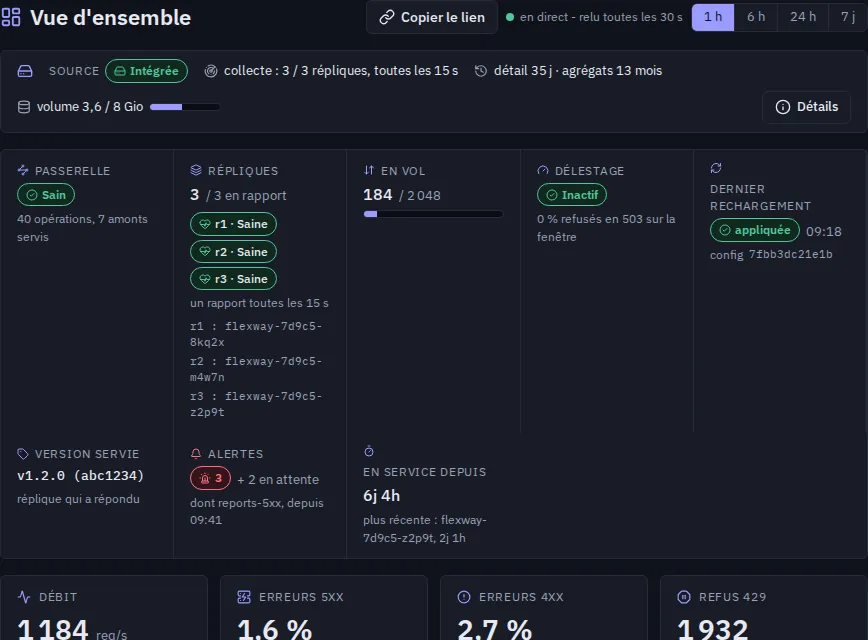
The console shows traffic, per-operation detail, waterfall traces and recent errors, per operation, upstream and tenant, even without an external metrics backend.
The traffic dashboard reads by operation, upstream and tenant, against the previous period, with trend and breakdown. An operation's detail shows throughput, errors by code, latencies and breakdown by tenant; two freely chosen windows can be overlaid on the same curves, and every configuration reload leaves a marker on them.
An end-to-end trace opens from the console. With no trace backend, the console receives the gateway's OTLP and keeps slow or failed requests through tail sampling, within count, duration and size bounds per replica, shown as a waterfall with the time spent in routing, identity, policies and upstream attempts. A log of recent errors can be filtered by operation, upstream and tenant.
The console works without an external metrics backend: it collects the metrics pushed by the gateway, keeps 35 days of detail and daily aggregates over 13 months, on a persistent volume. If you already have your own backends (metrics.url, traces.url), it reads them instead.
The Upstreams screen shows each upstream's circuit breakers, ejections and timeouts, and the gateway's own health reads per replica.
The Upstreams screen shows each upstream's circuit breaker state, ejections and timeouts, with the next scheduled trial, transitions and the codes written by the gateway. It reads as cards or as a table, with a 24-hour band and a detail view per upstream.
The gateway's own health reads per replica: each one's status according to its rule and the freshness of its last report, a draining replica announced as such, and a rule that flags a replica gone silent. A replica shutting down cleanly can thus be told apart from a lost one.
No complete example for this domain in release v1.6.3 yet: one will come with an upcoming release.
What is delivered in the published release v1.6.3, and what is coming; a feature is never shown as delivered before its release.
| Feature | Status |
|---|---|
| Structured JSON logs, no personal data | Delivered · v0.1.0 |
| Metrics per operation, upstream and tenant, bounded cardinality | Delivered · v0.1.0 |
| W3C traces propagated end to end | Delivered · v0.1.0 |
| /healthz, /readyz, /metrics, /config on a separate port | Delivered · v0.1.0 |
| Dashboards and alerts delivered with the product | Delivered · v0.1.0 |
| /simulate: route, effective chain and verdict without calling the upstream | Delivered · v0.1.0 |
| API catalogue derived from the contracts, with lifecycle | Delivered · v0.1.0 |
| Traffic per operation, upstream and tenant | Delivered · v0.1.0 |
| Declarative proposal: a diff, never a mutation | Delivered · v1.2.0 |
| Upstream health: circuit breakers, ejections, timeouts | Delivered · v0.1.0 |
| Usage: requests, tokens, euros, per tenant | Delivered · v0.1.0 |
| Opening an end-to-end trace | Delivered · v0.1.0 |
| Agents dashboard: tools called, cost, scopes | Delivered · v1.2.0 |
| Built-in alerts: thresholds per upstream or operation, webhook notification | Delivered · v1.3.0 |
| Developer portal: catalogue, try-out, keys | Planned |
| Health per gateway replica: status of each replica and freshness of its last report | Delivered · v1.4.0 |
| Service-level objectives per operation: remaining error budget, burn rate over several windows, built-in alert rule | Delivered · v1.3.0 |
| Log of the gateway's recent errors, filterable by operation, upstream and tenant | Delivered · v1.3.0 |
| Traces seen by the gateway, in the console: a sample of slow or failing requests, with the duration of each step (routing, identity, policies, upstream) | Delivered · v1.3.0 |
Flexwiz is a young company: you talk directly with the person who founds it. Tell us what you want to run through Flexway. We talk about your infrastructure and your digital sovereignty requirements.
Online booking is coming soon; until then, an e-mail is enough.